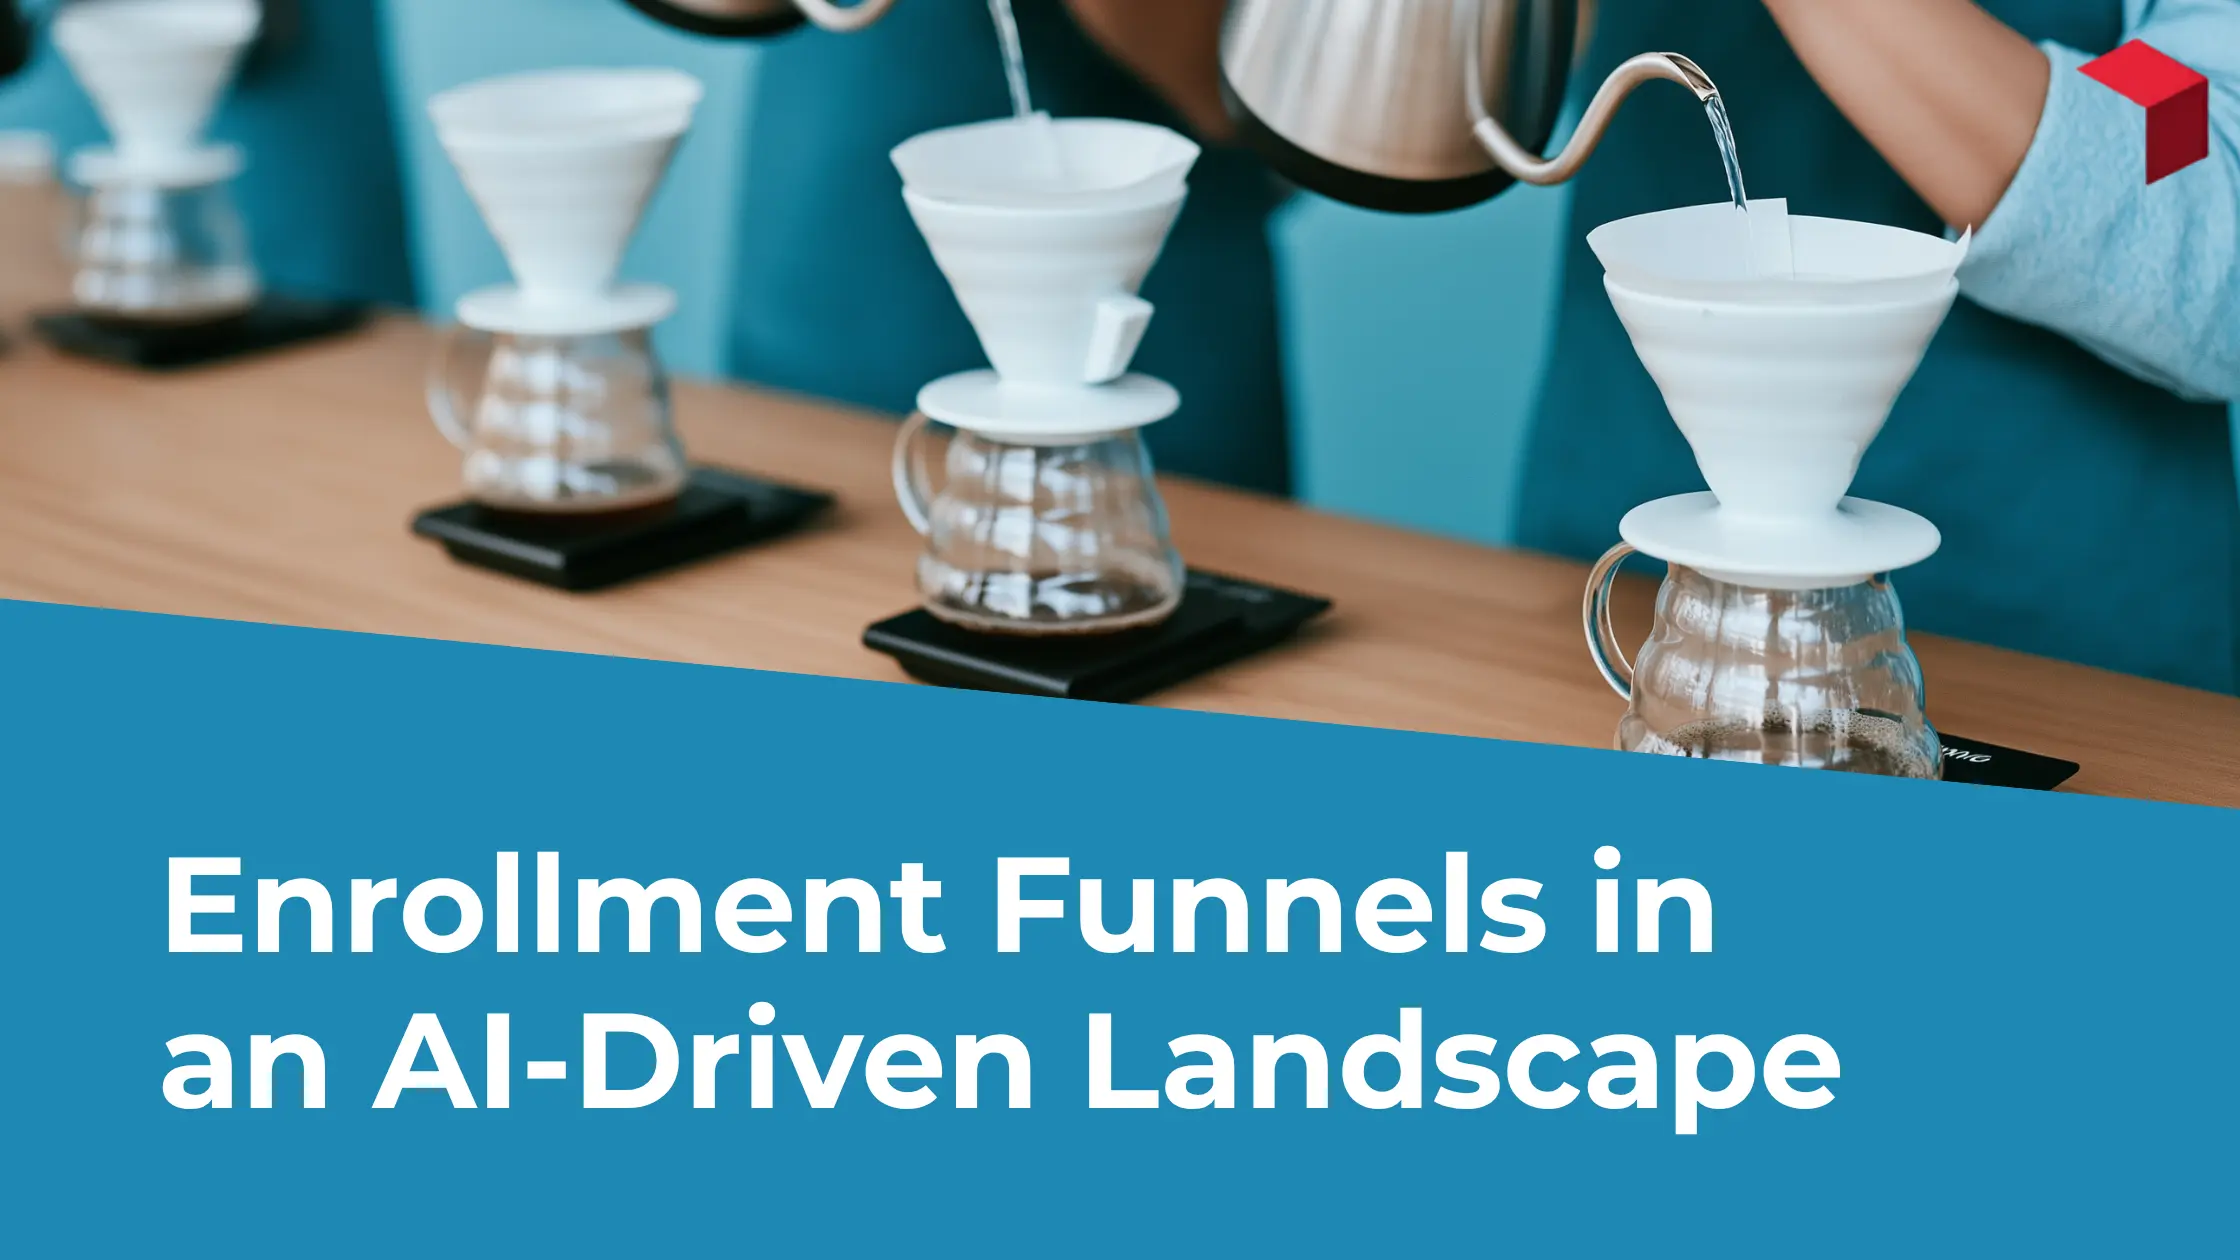
That model is becoming less reliable.
Prospective students can now discover institutions through Google, AI Overviews, ChatGPT, Gemini, Perplexity, social platforms, college search sites, and traditional referrals. In many cases, a student may learn about a college through an AI assistant without ever clicking directly from that platform. This shift has made AI visibility an increasingly important part of higher education marketing.
This creates a new measurement challenge for higher education: a decline in organic traffic does not necessarily mean a decline in prospective student interest.
The better question is:
Are we losing prospective student discovery, trust, and applications overall, or has the path to enrollment simply changed?
Organic Traffic Is No Longer the Entire Discovery Story
Historically, a common enrollment journey might have looked like this:
Google Search → Program Page → Admissions → Apply
Today, that journey may look more like:
AI Assistant → Branded Google Search → Program Page → Apply
or:
Google AI Overview → Direct Visit → Admissions → Apply
or even:
ChatGPT Recommendation → College Comparison → Return Later Through Direct Traffic → Apply
In these scenarios, AI may be influencing enrollment without appearing as a measurable referral source in analytics.
That means institutions should be careful when interpreting declines in organic traffic. Some traditional search activity may be replaced by AI-assisted discovery, branded searches, direct visits, or zero-click interactions.
The goal should not be to preserve every organic session.
The goal should be to preserve and grow qualified prospective student discovery and enrollment activity.
How is Your Website's AI Visibility?
How people are finding you is rapidly changing. Our AI Readiness Audit will show you:
- How users are seeing you on key queries
- Your competitive position across platforms
- Actionable next steps
Start With the Enrollment Funnel, Not the Traffic Channel
A useful measurement framework is:
Enrollment Discovery
↓
Program Consideration
↓
Admissions Intent
↓
Application
↓
Enrollment
Each stage can be measured using a combination of website analytics, search data, AI visibility, and application data.
1. Enrollment Discovery
This is where prospective students first encounter you.
Traditional indicators may include:
- Organic search visibility
- Non-branded search traffic
- Branded search demand
- Direct traffic
- Referral traffic
- Paid campaigns
- Social traffic
AI should now be considered part of this discovery layer as well.
Institutions can begin measuring:
- How often the institution appears in AI responses
- How often specific academic programs are mentioned
- Whether official institutional pages are cited
- Whether tuition, admissions, outcomes, and program information are accurately represented
- How visibility compares with peer institutions
Rather than asking only, “Did organic traffic decline?” institutions should ask:
“Did our overall share of prospective student discovery decline?”
2. Program Consideration
Once a student discovers you, the next question is whether they continue researching it.
Useful indicators include:
- Program page engagement
- Returning users
- Visits to tuition and financial aid content
- Accreditation and outcomes content
- Faculty and curriculum pages
- Campus life content
- Internal navigation from programs to admissions
- Multiple visits across the consideration period
This stage is especially important for evaluating trust.
A student may discover a college successfully but fail to progress because information feels incomplete, inconsistent, outdated, or less convincing than what they find elsewhere.
That creates a very different problem from a visibility issue.
3. Admissions Intent
Admissions intent is where website behavior begins to show stronger enrollment signals.
Examples include:
- Apply clicks
- Request Information submissions
- Visit registration
- Application portal visits
- Financial aid engagement
- Admissions requirement views
- Transfer information engagement
- Contact with admissions staff
These smaller signals are often best treated as micro-conversions within the enrollment journey rather than isolated website events.
For example, a university might experience a 15% decline in organic traffic while maintaining the same number of application starts. In that situation, the decline in traffic may not represent an enrollment problem at all.
It may simply indicate that prospective students are reaching you school website through different paths or arriving with stronger intent.
Measuring Loss of Trust
Loss of trust is difficult to attribute directly, but institutions can look for patterns across the enrollment funnel.
Potential warning signs include:
- Stable program traffic but declining application activity
- Increasing visits to tuition or accreditation pages without corresponding progression
- Lower program-to-admissions click-through rates
- Declining returning-user activity
- Increased branded searches involving terms such as “reviews,” “accreditation,” “cost,” or “worth it”
- Higher exit rates from key enrollment pages
- Lower application-start rates despite stable traffic
No single metric proves a trust problem.
However, when several of these signals move together, they can indicate that prospective students are finding you but are not developing enough confidence to move forward.
Measuring AI Visibility
AI visibility should be treated similarly to search visibility.
Institutions can build a set of realistic prospective-student prompts such as:
- Best nursing programs in Iowa
- Affordable colleges near Des Moines
- Colleges with strong cybersecurity programs
- Universities with good financial aid
- Best colleges for transfer students
- Colleges offering online business degrees
These prompts can then be tested across major AI platforms.
The institution can measure:
- Percentage of relevant prompts where it appears
- Programs mentioned
- Accuracy of institutional information
- Frequency of official-source citations
- Presence alongside peer institutions
- Whether the school is included in recommendation sets
This creates an AI share of visibility that can be monitored over time.
Measuring AI Trust, Not Just AI Mentions
Being mentioned by an AI platform is not necessarily valuable if the information is incomplete or inaccurate.
Institutions should evaluate whether AI systems correctly represent:
- Program availability
- Tuition and fees
- Admissions requirements
- Accreditation
- Degree format
- Campus location
- Student outcomes
- Financial aid availability
- Transfer policies
A useful internal framework could classify AI responses as:
Absent → Mentioned → Accurately Represented → Cited → Included in Consideration
This provides a more meaningful picture of AI performance than simply counting mentions.
Estimating the Application Opportunity Gap
Because attribution across search, AI, direct traffic, and branded search is imperfect, institutions should avoid claiming that AI visibility caused an exact number of applications.
Instead, use an estimated application opportunity model.
For example:
If an institution appears in 15% of relevant AI prompts while comparable institutions appear in approximately 35%, that represents a 20-point discovery gap.
That gap can then be modeled using reasonable assumptions around:
- Search or prompt demand
- Website visitation
- Application-start rates
- Application completion rates
The result should be expressed as a range rather than a precise figure.
For example:
Based on current AI visibility and downstream enrollment behavior, you may have an opportunity to generate an additional 15–40 completed applications per month if discovery visibility improves.
This approach is much more defensible than stating that a specific number of applications were “lost to AI.”
Compare Programs Against Each Other
One of the most useful ways to analyze AI visibility is at the program level.
Institutions can group programs into:
Higher AI Visibility
and
Lower AI Visibility
Then compare trends in:
- Branded program searches
- Organic traffic
- Direct traffic
- Program page engagement
- Admissions progression
- Application starts
- Completed applications
Over time, this can help identify whether stronger AI visibility corresponds with stronger enrollment behavior.
It also gives institutions a practical way to prioritize optimization efforts.
If a high-demand program has strong traditional search rankings but weak AI visibility, it may represent a meaningful growth opportunity.
Add AI to Application and Inquiry Surveys
One of the simplest ways to improve attribution is to ask prospective students directly.
Institutions could add a question such as:
What helped you decide to learn more about us?
Possible responses:
- Google or another search engine
- ChatGPT or another AI assistant
- College search website
- Social media
- Online advertising
- Friend or family
- Counselor
- College fair
- Previous familiarity
- Other
A second question could ask:
Did you use an AI assistant such as ChatGPT, Gemini, or Perplexity while researching colleges?
Over time, this can provide valuable context that analytics platforms alone cannot capture.
Rethinking the Meaning of an Organic Traffic Decline
A decline in organic traffic should not automatically be treated as a negative outcome.
Some traditional organic discovery may be offset by:
- AI-assisted discovery
- AI referral traffic
- Branded search
- Direct visits
- Zero-click search behavior
- Shorter research journeys
- Better-qualified visitors
The key question is whether downstream enrollment activity is also declining.
If organic traffic falls while:
- Program engagement remains healthy
- Branded demand increases
- Application starts remain stable
- Completed applications increase
then you may simply be experiencing a change in how prospective students discover and evaluate your school.
Traffic is becoming a supporting metric.
Enrollment outcomes are the real measure.
A More Useful Higher Education Measurement Framework
At iFactory, we recommend viewing website performance through the complete prospective-student journey. That requires analytics built around meaningful actions and outcomes rather than pageviews alone.
Enrollment Discovery
Measure:
- Organic search visibility
- AI visibility
- Branded search demand
- Referral and direct traffic
- Competitive share of voice
Program Consideration
Measure:
- Program engagement
- Returning users
- Tuition and financial aid engagement
- Accreditation and outcome content
- Internal progression toward admissions
Admissions Intent
Measure:
- Apply clicks
- Request Information
- Campus visits
- Application portal activity
- Admissions content engagement
Application and Enrollment
Measure:
- Application starts
- Completed applications
- Acceptance
- Deposit
- Enrollment
This allows institutions to move beyond a channel-by-channel view of website performance and instead evaluate whether the digital experience is successfully supporting enrollment.you
The Bottom Line
Search behavior is changing, but the purpose of higher education websites has not.
Institutions still need to help prospective students discover programs, develop confidence, understand cost and outcomes, and take the next step toward enrollment.
Organic traffic remains important, but it should no longer be evaluated in isolation.
As AI becomes a larger part of student research, colleges and universities should measure the entire discovery and enrollment ecosystem.
The most important question is no longer:
“Did our organic traffic increase?”
It is:
“Are more prospective students discovering us, trusting what they find, and progressing toward enrollment?”
Not Sure Where Your Institution Stands?
iFactory’s AI Search Readiness Audit evaluates whether tools like ChatGPT, Perplexity, Google AI Overviews, and Claude can find, understand, and recommend your institution to prospective students.